This week I went high-tech to go low-tech. When I taught physics I taught with a student centered pedagogy called Modeling Physics. In Modeling we have student collect data and then use that data to construct models to explain physics. Basically students do labs, graph the data, find an equation that fits their graph and then they turn that equation into a generic equation that can be used in other situations. Everything works great if you can get the students to collect really clean data and if you can actually convince them to think.

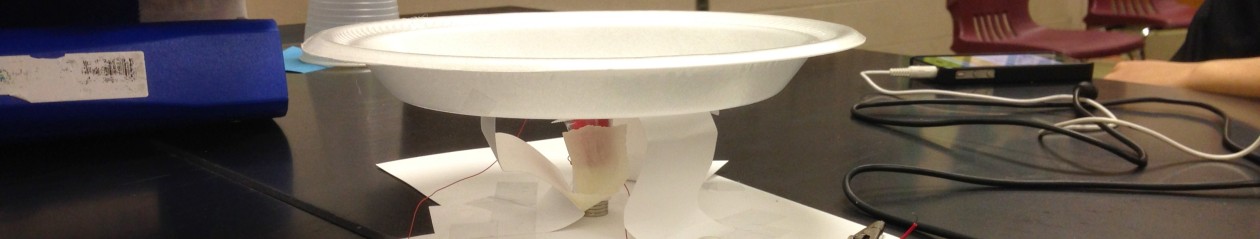
I don’t teach physics anymore, but our new physics teacher, Vance, also uses the Modeling Method. He built some apparatuses last week end to collect really good acceleration data. This is just a wood disk with a golf tee glued to the center of each side. This rolls down a pair of rails and is slow enough to allow students to get some really good data. I’d thought about building these myself in the past, but I knew it would be hard to do and that I’d probably screw it up. So I never constructed any. Vance did a fine job in his construction, but he ended up having all the problems I knew I would have had.
Enter the 3D printer. Looking at Vance’s system I knew I could knock something out on the 3D printer that would work. This is one of the coolest things about owning a 3D printer. You will see problems and begin to envision solutions. Once you start doing this the easier it becomes. The only risk is that you will quickly assume the 3D printer is the best tool for all jobs. As awesome as it is, it is not always the best way to solve every problem.
 I spent about 10 minutes in Tinkercad on my design and then it took about an hour and a half to print. Vance tells me it worked great for the lab. I’m already envisioning modifications for future investigations. The design could be easily modified to investigate rotational inertia and energy, but maybe I’ll leave it to students to create these new designs.
Acceleration Paradigm Lab – Teacher Notes
Materials (for each group):
- 2 bricks with holes or grooved sides
- 2 five foot sections of electrical conduit
- 1 wood disk with a golf tee sticking out of the center of each side, or 1 3D printed disk with cones out of each side
- Dry erase marker
- A metronome set to 60 peats/minute (or a computer program) – One for the entire class
- Set the conduit up as a pair of rails spaced appropriately for your rolling disk
- Let the disk roll down the rails
- Mark the position of the disk at 1 or 2 second intervals
- Create a position vs. time graph and find the equation that fits the data (should be a quadratic)
- Create a velocity vs. time data set and graph from the position data using the secant line created by each pair of points on the position graph. This graph should be linear.
- Note: If the incline is too steep it will slide rather than roll.
- I always have students use the actual variables in their equations, no x’s or y’s. In addition all constants need units.
- Once students have equations for both their position and velocity graphs I ask them what each constant represents and how they know. This is pretty easy for the velocity graph, but a little harder for the position graph. It leads to some great conversations and ultimately to a pair of generic equations we will use for the rest of the kinematics unit.
- On Thingiverse
- On Tinkercad: the Disk, the Side Cones.
Very appreciated, Steve – you da MAN! 🙂
At my modeling physics workshop I had a presenter make every one a set. The golf tee's are in backwards. I bet they wandered to the edge and rubbed the rail. see:
http://www.slapt.org/resources/equipment/inexpensive_motion_equip.pdf
The metronome is a great way to make time the independent variable.
I'm also visiting this site regularly, this web site is really nice and the users are genuinely sharing good thoughts.http://www.3dprintinggeeks.com/